
Lab42 | Profit-first growth for Indian DTC brands
Profitable before it scales.
We run Meta, Google and the creative for Indian DTC brands. Every decision starts from your breakeven and ends in cash, not ROAS.
Watch the 4-minute breakdown: how we scale DTC brands on margin, not ROAS.


















- Meta
- Shopify
- GA4
- BigQuery
- Looker Studio
- Asana
Growth you can verify in the store’s own numbers.
From ₹14 lakh to ₹1 crore+ a month. First ₹1 crore month in 14 months, peaking at ₹1.65 crore. Grown on profit, not just ROAS.
A screen recording of a client’s Shopify total sales over time. Revenue is what you see here. The profit work behind it is what the case studies below explain.
- 60+DTC brands worked with
- 83%Clients stay 12+ months
- 8+ yrsHands-on in DTC
- ₹65Cr+Revenue driven
Winning ads are not a winning business.
Profit per order is falling.
Your bank balance is empty.
Sounds familiar?
- ROAS looks fine, but cash is tight at month end.
- Revenue is up, but the bank balance is not.
- The agency report says growth. Your accountant says otherwise.
Why “creative-first” strategies fail.
What actually drives scale
- Creative as targetingAds that attract the right customers, not just new designs.
- Product roleSome products win one-time buyers, others win loyal customers.
- Offer economicsA high-ROAS offer can still lose money on every new customer it acquires.
- InsightsData that reveals business levers and ties back to cash flow.
- Profit
Most agencies optimise creative. We optimise profit.
Six steps. Each one ends in a cash decision.
Profit baseline
Find your breakeven revenue and the ROAS you need to hit it.
Rank products
See which products drive orders, sales and RTO, and which acquire or also retain.
Order drivers
Find which creative, message, persona and offer drive each product’s sales.
Find the levers
Pick what to change in the communication to scale each product.
Implementation
Deploy into creatives and campaign structure across Meta, Google and more.
Tracking (42IQ)
One central dashboard that tells you what to scale, cut or fix this week.
What our ads do, at scale.
One account, all-time, platform-reported. Sorted by spend, not by return.
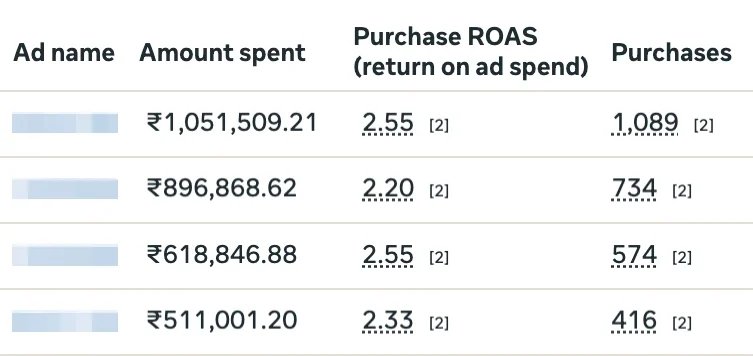
Rearranged for mobile, conversion value column left out. Same cells as the full report below, ad names redacted.
Ad names and objective column removed, middle rows skipped. Tap to see the full report.
- ₹5.59 Cr ad spend
- 52,251 purchases
- 2.35x average purchase ROAS
- 4,670 ads run
All-time, Meta-reported. Ad names redacted. Figures unedited.
Yes, we make the creative. Here is how it is decided.
Every ad starts from a persona, a stage and an objection, not a guess. The brief comes first, then the hooks, then the ad.
- First-time buyer
- Early in career
- Leaving legacy brands
- Education-led
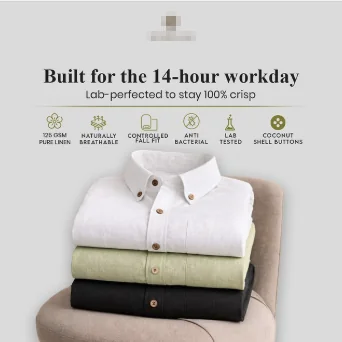
First-time buyers are leaving legacy brands and want to know what they are paying for.
Live ad headlines from that brief:
- Rich people will not tell you
- This linen isn’t factory-made. It’s crafted.
- Built for the 14-hour workday
- Lab-perfected to stay 100% crisp



- Existing shapewear user
- Problem aware
- Static
- Emotional
Users are anxious their shapewear will roll over time.
Example hooks written from that one insight:
- Did it roll again?
- Still pulling it up?
- Back already?
- Checking again?
- Never pull it up again.

Concept moodboard built from the brief
The brief also decides the format.
A comment-reply video: the comment is answered on screen and the fabric is shown, not described.
Every ad is logged before it ships. This is the sheet we work from.
Persona, stage, hook, trigger, objection and hypothesis, logged for every ad.
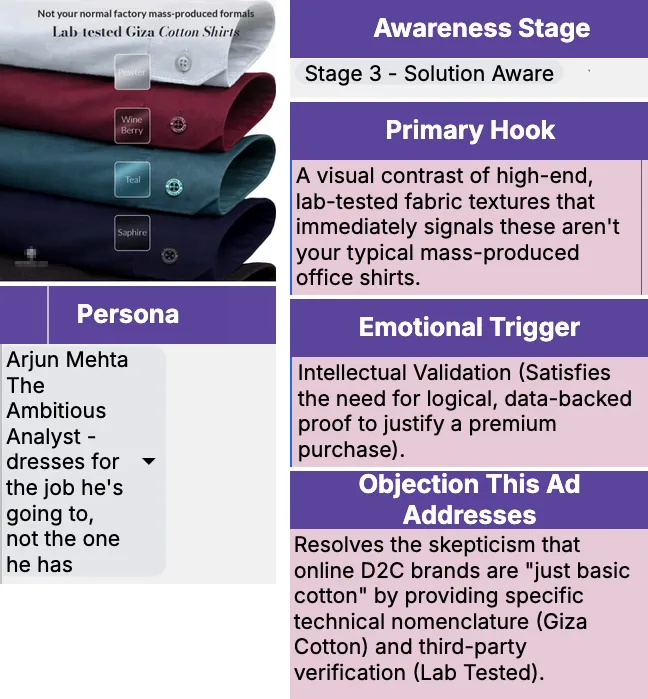
- Persona
- Awareness stage
- Hook
- Emotional trigger
- Objection
- Hypothesis
Want this on your account? Book a 30-minute fit call.
Book a 30-min callMargin first. Revenue followed.
Three Indian DTC brands. Figures straight from Shopify.
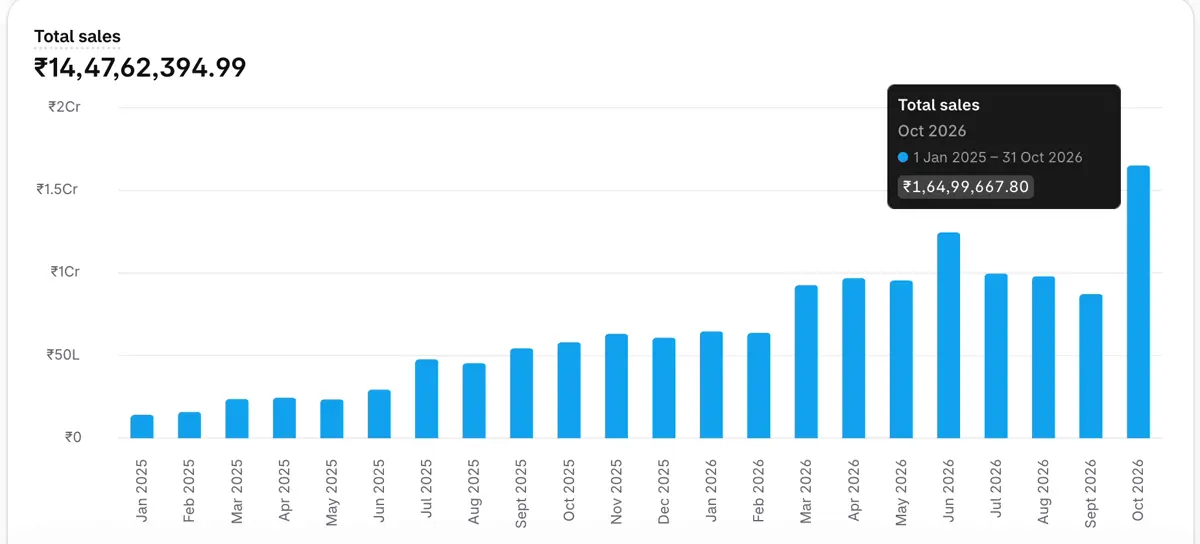
₹14L to ₹1.65 Cr / month
- Inventory tracking
- Theme-wise creatives
- Category-wise scaling
- Offer testing
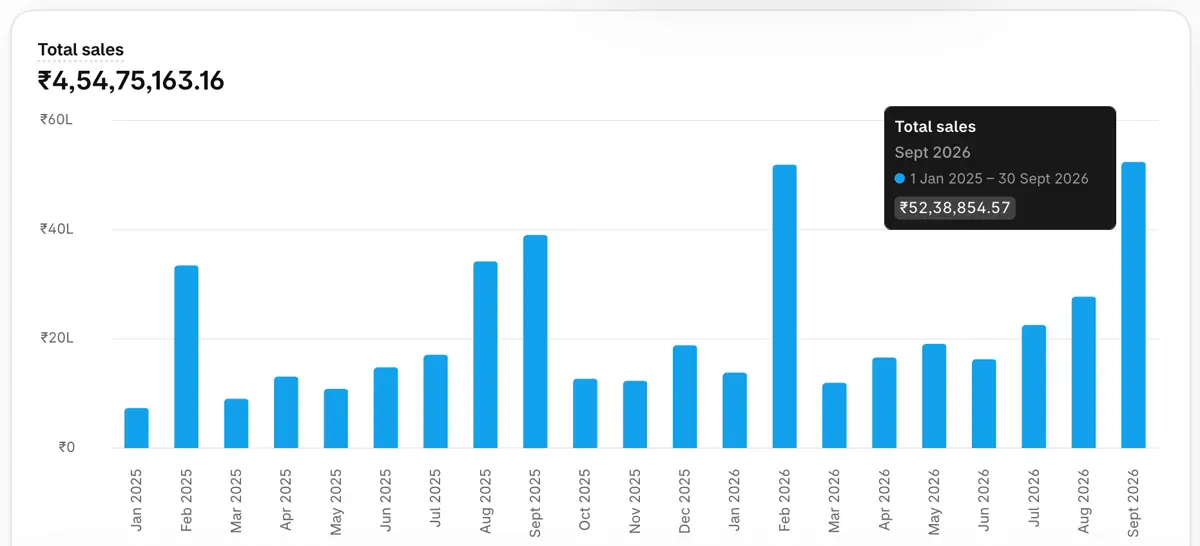
₹33L to ₹50L+ / best month
- Seasonal scaling
- High average order value
- International expansion
- Offline sales lift
Want this on your account? Book a 30-minute fit call.
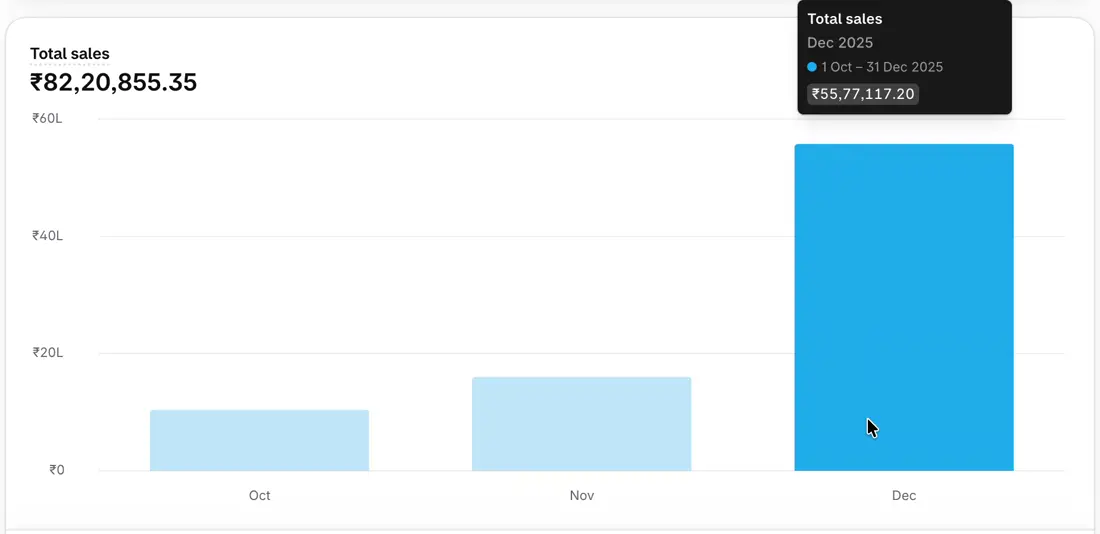
₹10L to ₹55.8L / month
- Media buying
- Hyper scale
- Seasonal scaling
What you see inside the engagement.
Real screens from the tools we run each brand on, redacted. Each one exists to trigger a decision.
Catch ads that stop paying before they drain spend.
Live ads graded on how far they have decayed, so the weakest are obvious.
Know which ads earn customers, not just clicks.
Ads ranked on cost per customer, so winners and losers are clear.
Set the number each channel has to hit.
A benchmark sheet to compare against today’s results.
See each category’s return, every day.
Spend, revenue and ROI by category, one row per day.
Spend on acquisition only while it pays back.
Lifetime value against acquisition cost, tracked as one ratio.
Scale ads into stock you actually have.
Stock by size against demand, with SKU and product names redacted.
Three ways to run growth. One optimises for profit.
| What matters | ROAS-led agency | In-house hire | Lab42 |
|---|---|---|---|
| Optimises for | ROAS and revenue | Their own KPIs | Profit and cash |
| Knows breakeven ROAS | Rarely | Only if finance shares data | Yes, set before any spend |
| Stock-aware spend | Not usually | Yes, close to the stock | Yes, through 42IQ |
| Brand experience | Broad, but ROAS-led | One brand, deep | 60+ brands, one profit system |
| Commitment | Often a share of ad spend | Salary, plus months to hire | Retainer, no lock-in |
| Time to start | Days | Months | Full system live in 5 days |
An in-house hire can be the right answer once you are large enough. Many of our brands add one later.
Want to see how this works on your account? Book a 30-minute fit call.
Founders who worked with Sagnik and Shrayav.
Recommendations from work we did before and alongside Lab42.
“He often went the extra mile to ensure that we were always updated on how the marketing efforts translated into business decisions.”
 Radhesh Sirohiya
Founder, Shyle · Shark Tank India S4For Shrayav · LinkedIn recommendation
“We went from zero to strong early traction in months, thanks to his ability to combine data-driven marketing with sharp business sense.”
 Tamanna Singh
Founder, MenovedaFor Shrayav · LinkedIn recommendation
“I worked closely with Sagnik, where he managed the performance marketing and retention marketing for our D2C fashion brand. … He has very good analytical skills to understand data and turn insights into actionable strategies that enhance performance and ROI.”
 Sanchit Jain
Entrepreneur, D2C fashion brandFor Sagnik · LinkedIn recommendation
“He led the Facebook strategy and execution when we just started. We scaled to top supplement brands in Singapore within the first six months.”
 Shantanu Kumar
CEO, XandroFor Shrayav · LinkedIn recommendation
“We’ve had an incredible experience working with Sagnik, who has played a key role in scaling our brand, Accent Mirror, by an impressive 50% in just six months.”
 Atif Malik
Founder, Accent MirrorFor Sagnik · LinkedIn recommendation
Know your breakeven before you spend another rupee.
See how one order turns into your breakeven ROAS, using the worksheet.
Not ready for a call? Start with your numbers.
Get the breakeven worksheet we use in every audit. Plug in your costs and see the revenue and ROAS you need to break even.
Straight answers
What revenue do you work with?
DTC brands doing ₹10L+/month. If your numbers don’t work yet, we will say so on the audit.
What does it cost?
No percentage of ad spend. You pay a monthly retainer plus a share of revenue after ad spend. KPIs are set so you stay profitable.
Do you guarantee profit growth?
No. Nobody honest can. We commit to the process, to a weekly cut, scale or fix call, and to stopping spend that does not pay back.
Is there a lock-in?
No. If we are doing our job you will want to stay. If not, you should not be stuck.
What do you handle?
Meta and Google scaling, creative concepts and copy, data structure, and guidance on product mix, CRO, bundling, offers and inventory planning. We do not run retention, but we give you the data to shape it.
Know if we are a fit before you book.
We are a fit if
- You do ₹10L+/month in revenue, or are close to it
- You have a gross margin above 60%
- You want to see profit and cash, not just ROAS
- You will act on weekly numbers
We are not a fit if
- You are not ready to share your cost and order data
- You want ROAS screenshots, not a profit view
- You need an SEO or retention agency
- You want scale in 30 days without knowing your breakeven
We started Lab42 after watching brands post strong ROAS and still run short of cash. Now every account runs on contribution margin, and you see it weekly.
At our last agency, we scaled a brand from ₹10L to ₹1.2Cr a month at a 2.2 ROAS. The breakeven was 1.8. Everyone was happy. We published it as a case study on LinkedIn.
Then the real financials came in. 40% of orders were RTO. The dashboard looked great, and the business was losing money.
We moved the brand to 100% prepaid and made decisions on margin. At lower revenue, the same business turned EBITDA positive by ₹10L a month. That is when we stopped chasing ROAS and started building Lab42 around profit.
Now we set breakeven before any spend, and we count RTO before we call a result.
We are two founders supported by a team of 5. We keep it small on purpose, so every brand gets our focus.
If that is how you want to run your brand, book a call.
 Sagnik
Co-founder, Lab42
Operations and delivery
 Shrayav
Co-founder, Lab42
Analytics and systems
See where profit leaks and what blocks scale.
Book a 30-minute call. We learn your business and check if there is a fit. If there is, we run your audit: your breakeven revenue, your biggest leak and the first fix. We run 6 audits a month so each one is detailed.
For brands doing ₹10L+/month, or close to it.What happens after you book
- 1BookPick a time and share your store URL.
- 2Fit callWe talk for 30 minutes and check if there is a fit.
- 3AuditIf there is, we run your audit.
- 4Live in 5 daysWe set up the full system and it goes live in 5 days.